
March 26, 2025
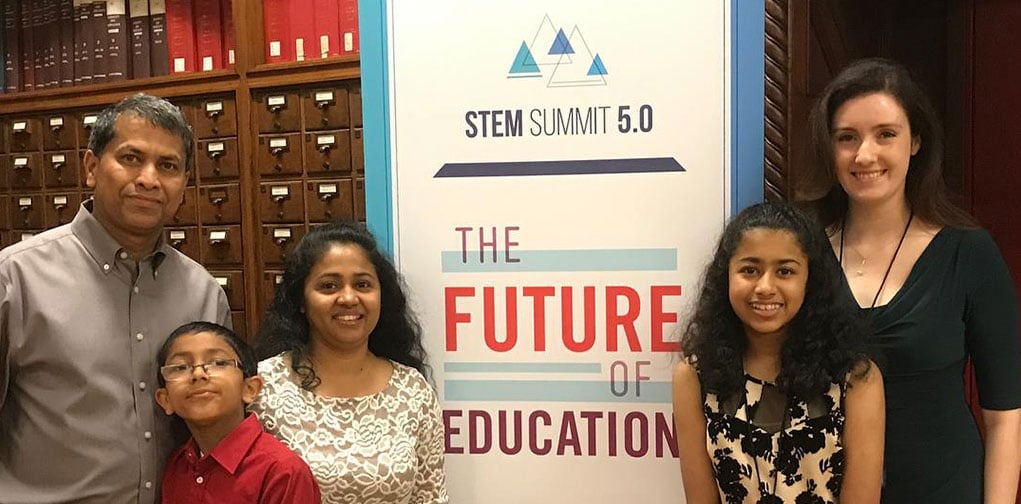
To read about Renton Prep’s additional experiences at the STEM Summit 5.0, please click here.
In addition to exploring the themes and locations in Julius Caesar, the student who presented with me, Leah, is interested in becoming a doctor. She wanted to use some of the new technology we’ve discussed to explore human anatomy and contrast the difference between using paintings or drawings with interactive models. This will be the topic of the STEM Summit 5.0 – Part 2.
First Stop: EthicsBefore really diving into the content, Leah spent some time studying the Hippocratic Oath. We could easily relate it back to our studies of ancient Greece and Rome and the earliest expression of medical ethics in the Western World. Using AI to research medical subjects could help Leah focus the direction of her field study earlier, or perhaps she could use the technology skills she learns to help innovate the medical field. At my recommendation, she used the Case Western University HoloAnatomy as a substitute for the HoloLens which we used a lot during our presentation on Rome.
Rather than use historic paintings of Julius Caesar as we had in our previous presentation, we replaced those images with classic paintings of anatomy lessons to contrast the progression of learning anatomy from a cadaver in person and seeing the context, to the innovation of the printing press that allowed for easier access to knowledge in print form. The drawback of that technology was flat images and learning words out of context of real life. HoloLens allows people to see the anatomy and physiology in ways textbooks can’t convey visual information.
Through the use of all of these tools, we have seen a definite increase in visual and spatial tools for education. I know that students will need skills to communicate ideas visually, even more within the next 5-10 years. Whether it’s through social media or across distance, or to persuade an audience or to illustrate a concept when working with a team, I’ve built in practice creating and demonstrating knowledge in visual ways. Leah helped to identify video clips she thought may serve as visuals for her presentation.
I’ve noticed that students who use HoloLens aren’t necessarily more able to verbalize their understanding than with print sources or vocabulary words; however, I do see their eyes light up and use hand gestures to try to articulate what they just saw. With some neuroscience background and looking at Vygotsky’s theories of children shifting from hands and speech to internalized thought, I’m interested in the potential holographic or mixed reality can have on conceptual learning before children are able to articulate that learning linguistically. It could also have implications for accessibility for those who can’t speak or control motor functions to use a pencil/pen.
Beyond that, since something like HoloLens has the potential to collect a large amount of data, there is the potential of creating multi-modal assessments that draw on AI processes to help students learn and assess their learning in different ways. There’s a possibility that this may allow a better transfer of learning than paper/pencil or multiple choice online tests. This would require a restructuring of multiple systems in education (which seems daunting).
However, the technologies all exist now in various forms, seen through different research universities and in practice at various industries. Bridging those gaps and connecting them with earlier education could have positive impact. That would also mean a different way of visualizing learning progress rather than a grade point average or a 100 point scale.
I got really excited at the Serious Play conference this summer when Richard Boyd introduced me to David Smith. He showed a live demo of big data visualization in HoloLens. I told him afterward I almost let out a little squeal of excitement, but everyone in the room was so staid. He chuckled a little and said it would have been just fine. I told him that it showed me I’m not entirely crazy, and if that exists to create multidimensional visualizations from Excel data spreadsheets, it could be entirely possible to demonstrate complex learning and model reports of progress in a multidimensional way – rather than a report card that gives us very little information about the learner or the transfer of learning to other contexts. Here’s an example of “a short video demoing a new 3D simulation language we (David Smith and colleagues) are working on. This will allow children to explore complex behaviors.”
If you want to learn more about STEM Summit 5.0 – Part 2, how we are integrating technology or how we are changing the education game at Renton Prep, we invite you to contact us today. We look forward to working with you to build a learning plan for your student; our plans are intended to meet students’ total educational needs and support them in their academic careers.


Stay informed with all the latest news at Renton Prep and Amazing Grace.